Browse Data
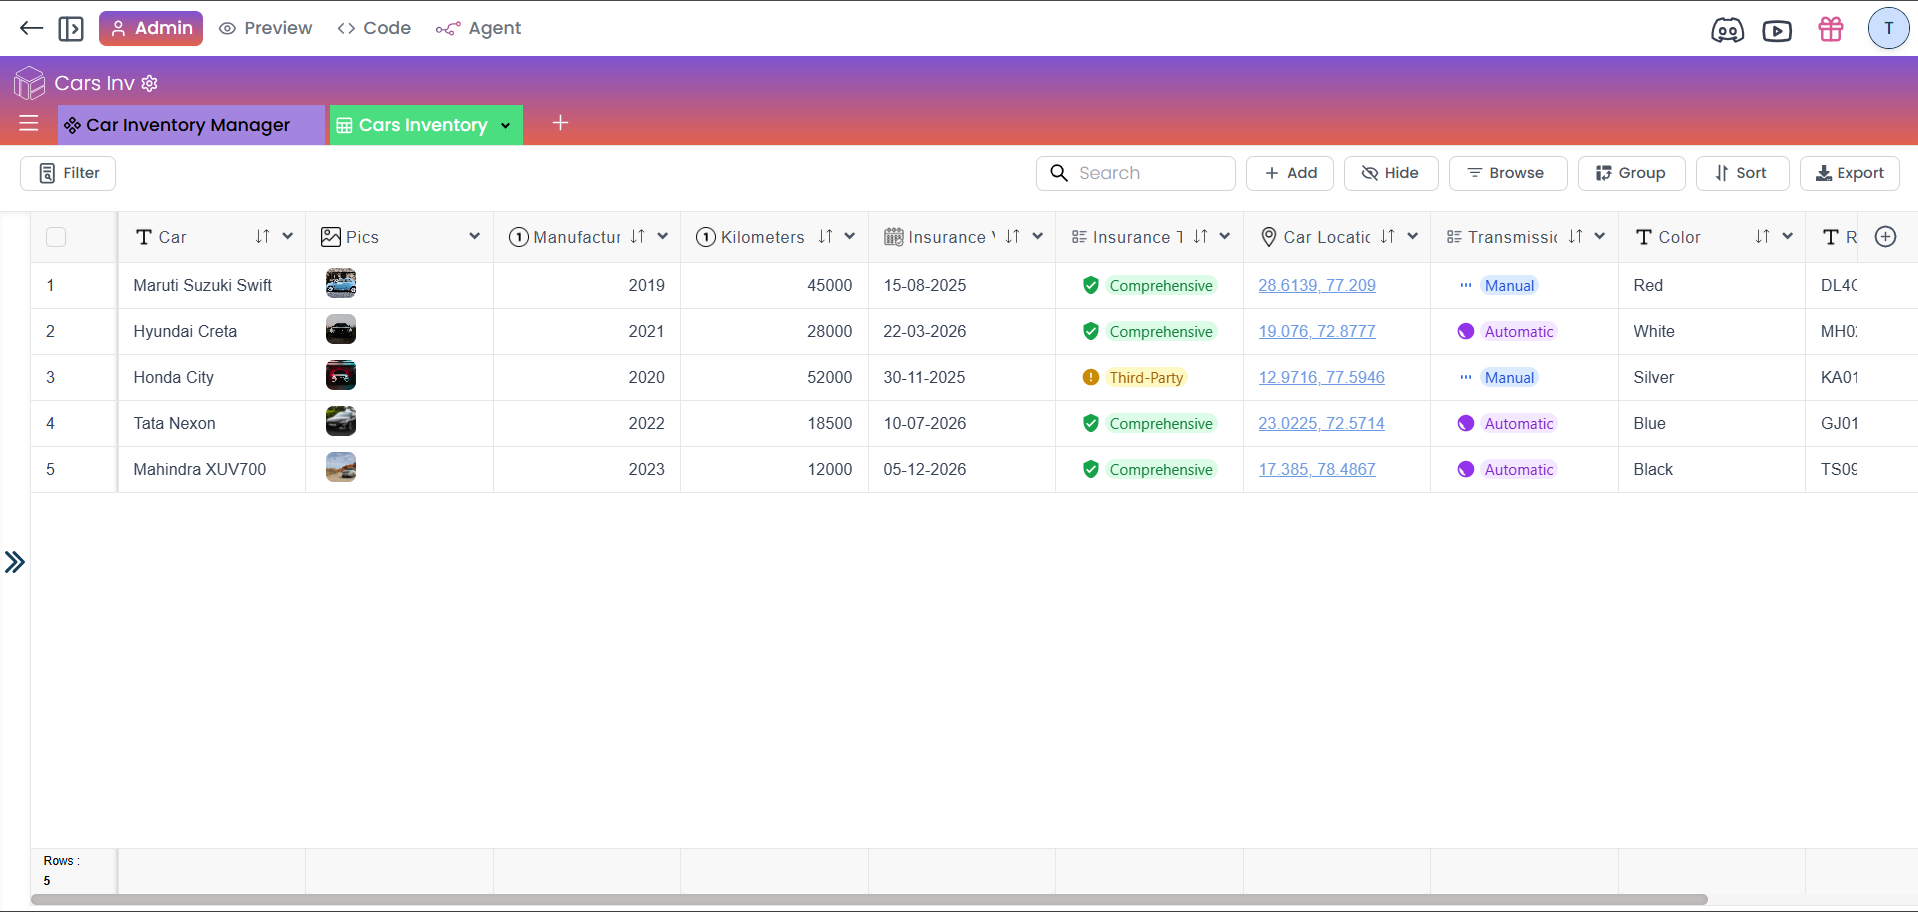
For this tutorial, we use a page from an online pre-owned car store. The table includes columns such as Car, Pics (car images), Manufacturing Year, Kilometers, Insurance Validity, Insurance Type, Car Location, Transmission, Colors, and Registration Data.
Browse Data
For this tutorial, we use a page from an online pre-owned car store. The table includes columns such as Car, Pics (car images), Manufacturing Year, Kilometers, Insurance Validity, Insurance Type, Car Location, Transmission, Colors, and Registration Data.
Browse Button
To narrow down the data, click the Browse button. This is the primary way to start browsing and refining your data.
Browse Conditions
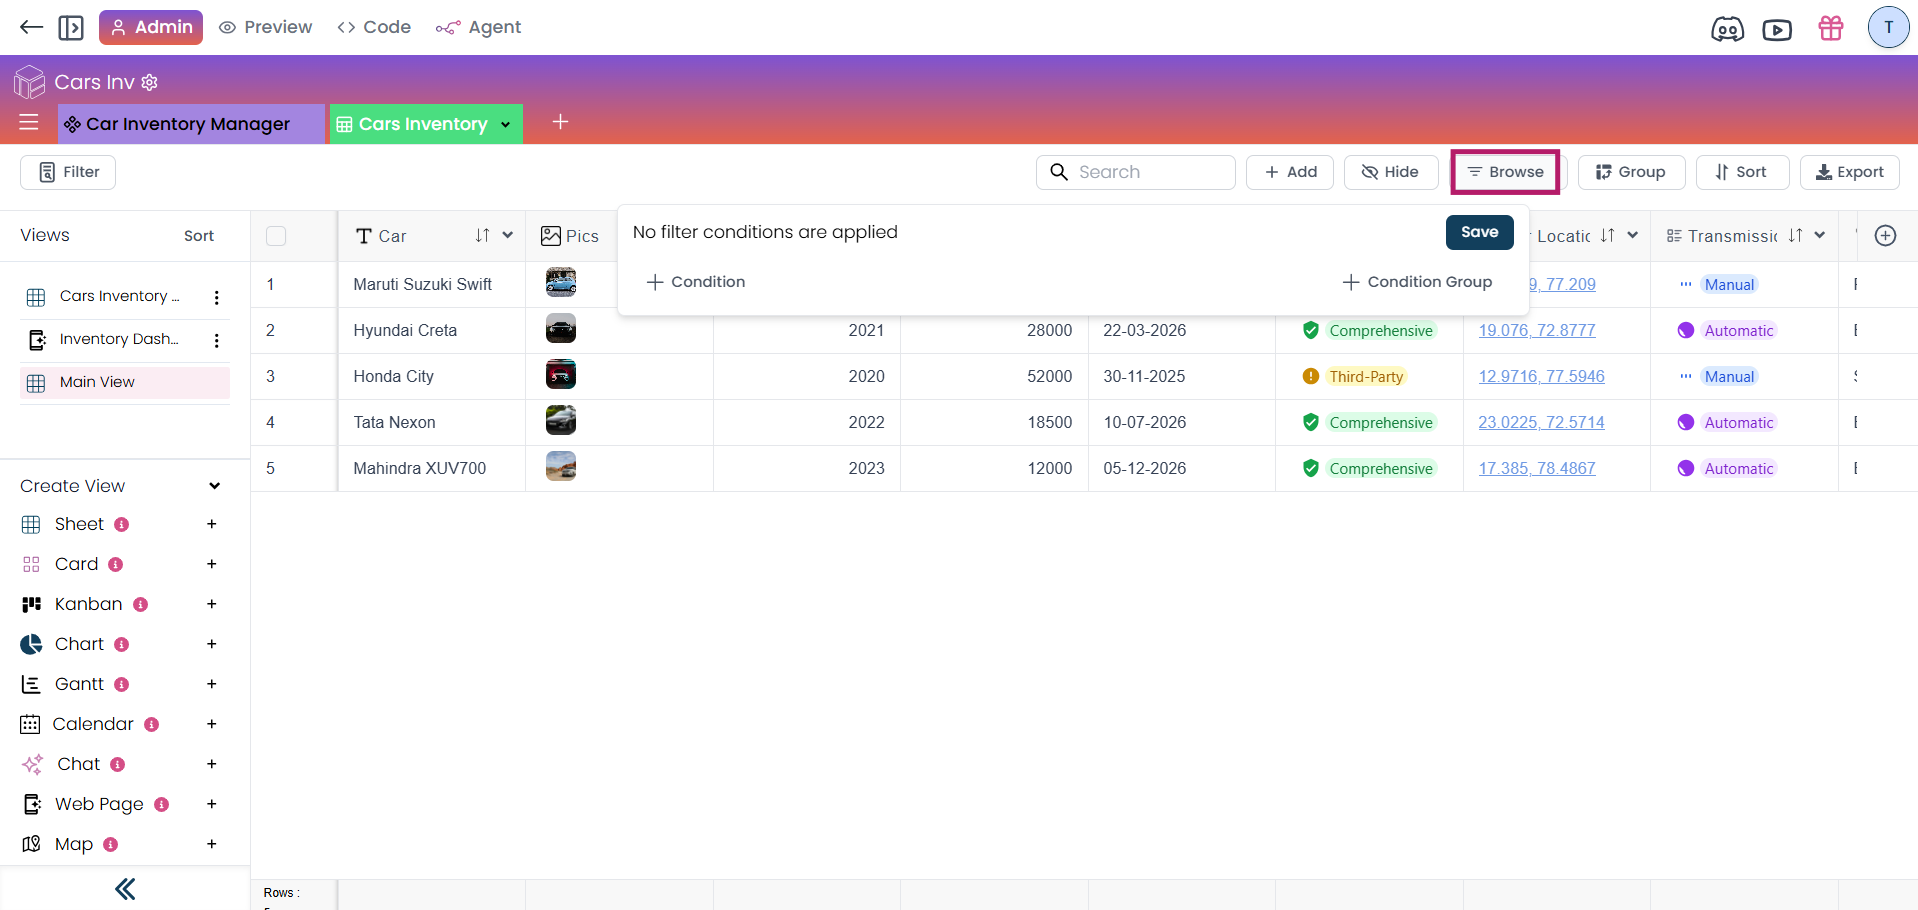
After clicking Browse, select the Condition option and choose the fields you want to work with. Available fields include Manufacturing Year, Kilometers, Insurance Validity, Insurance Type, Car Location, Transmission, Colors, and Registration Data.

Apply Browse
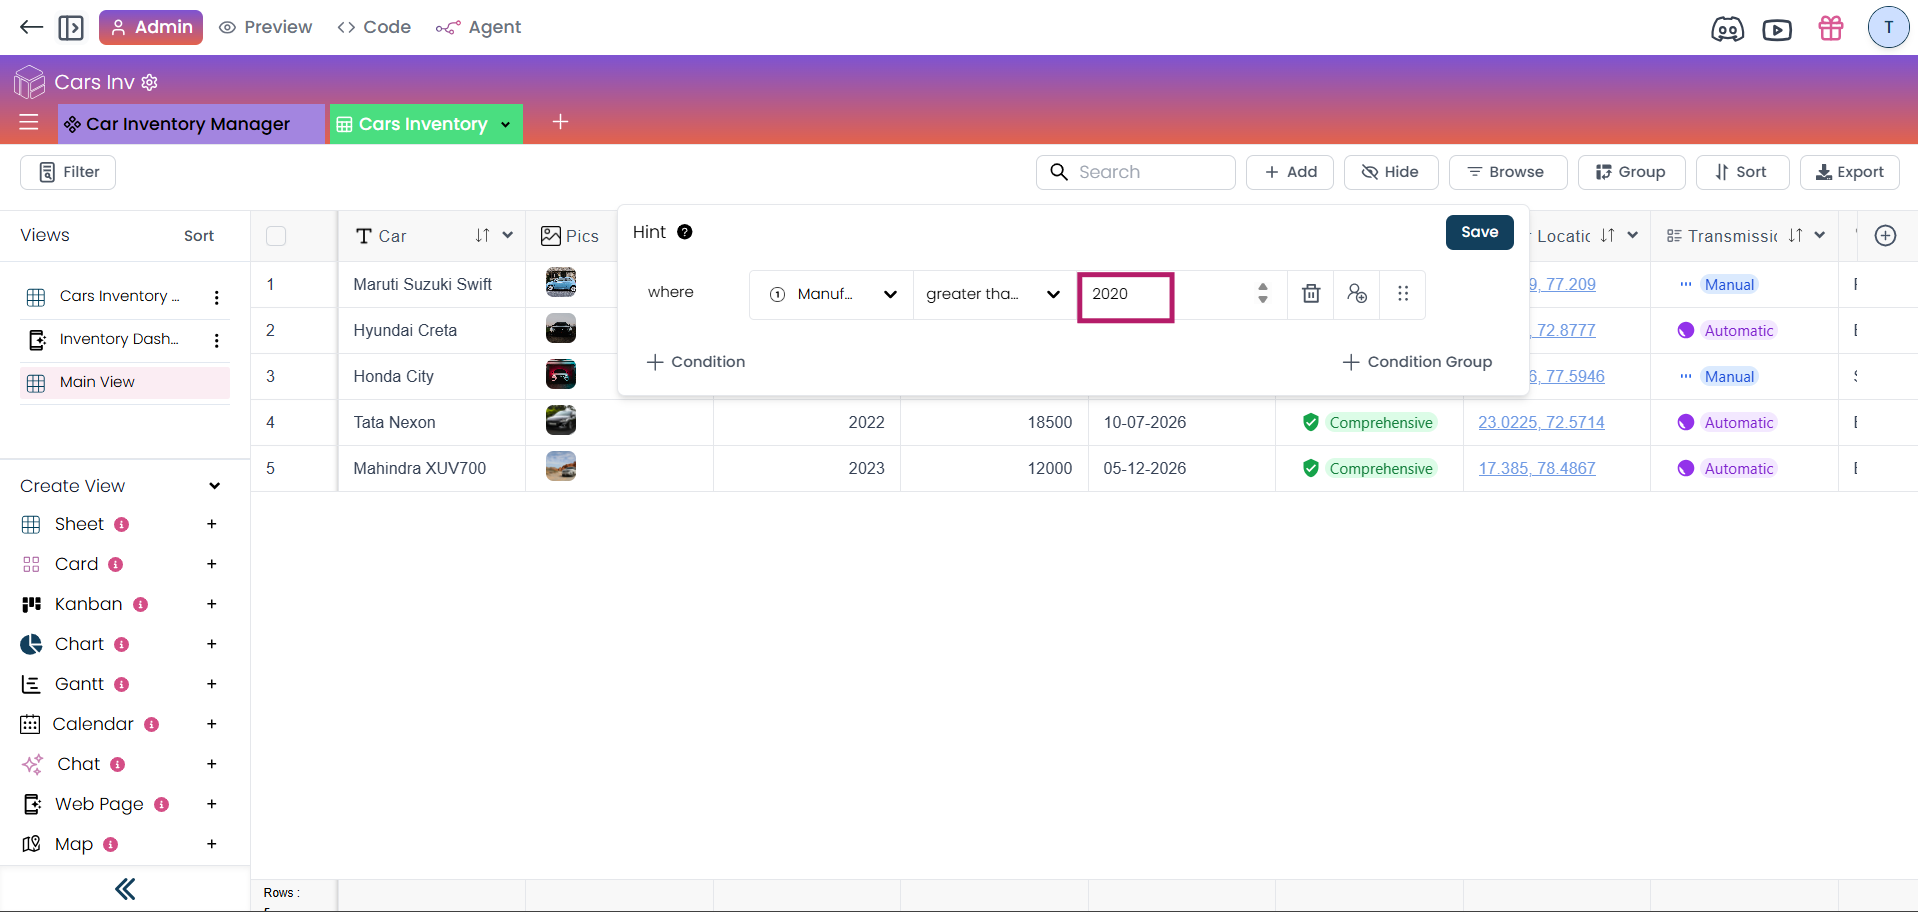
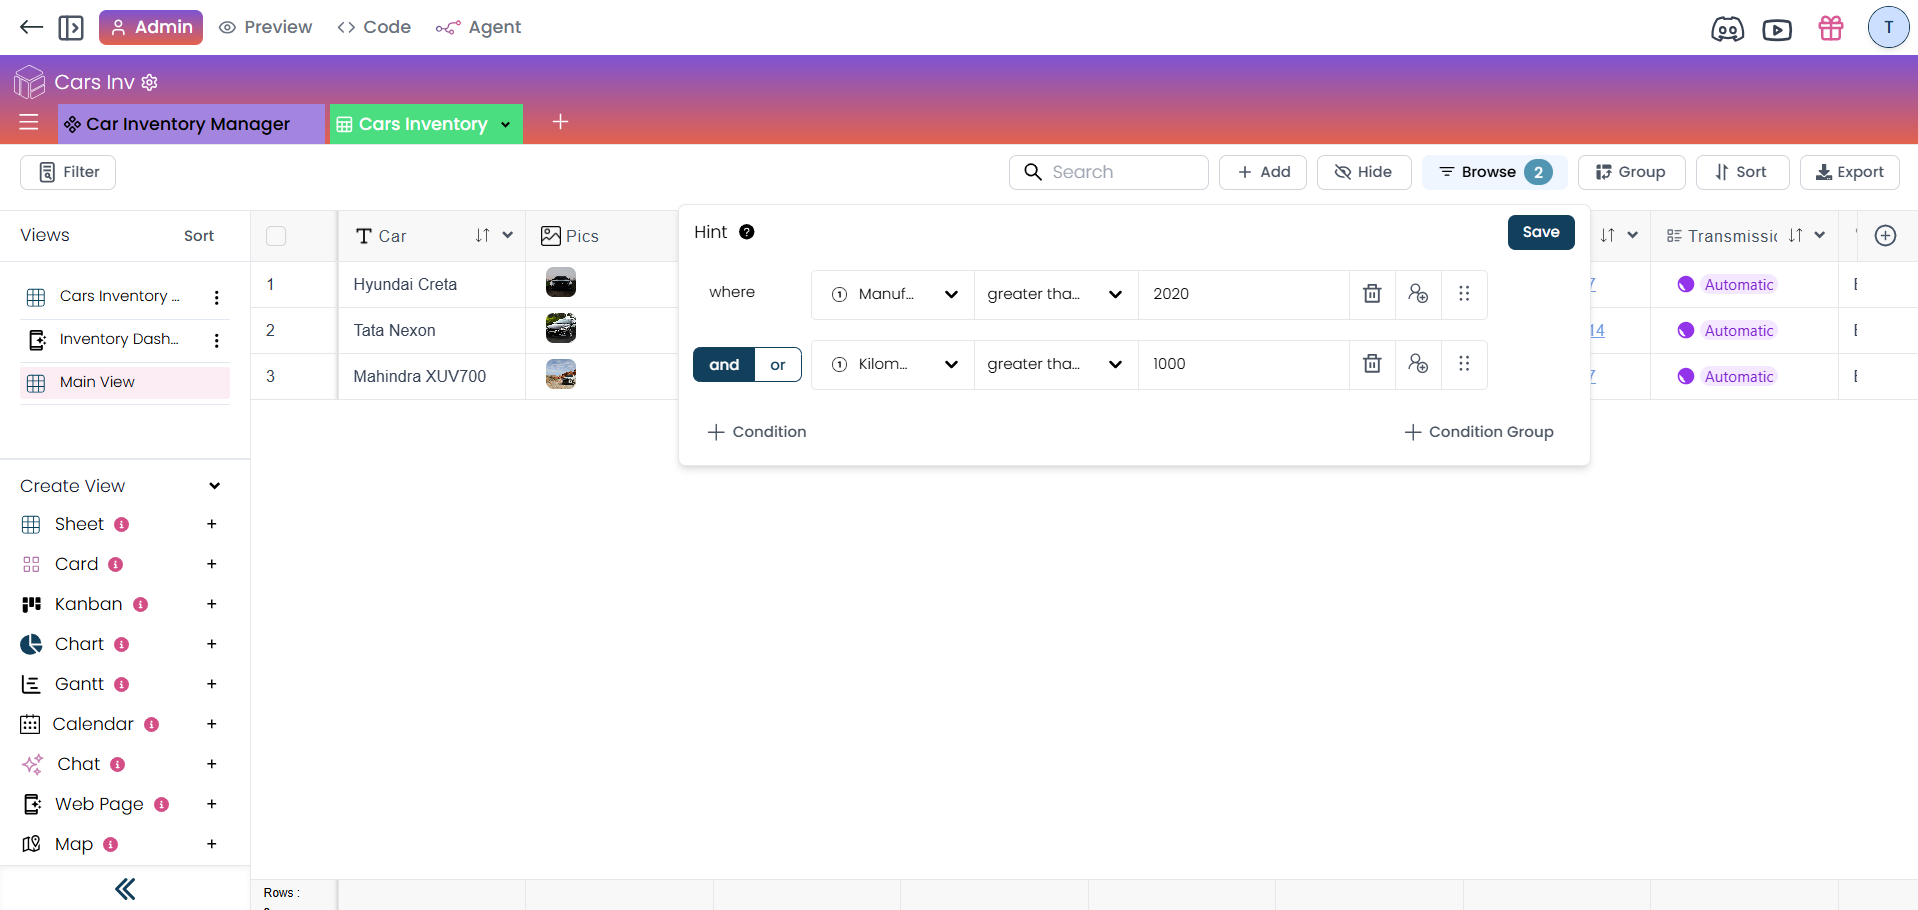
The filter will automatically build up. For example, apply a condition specifying that the manufacturing year is greater than 2020.
View Filtered Data
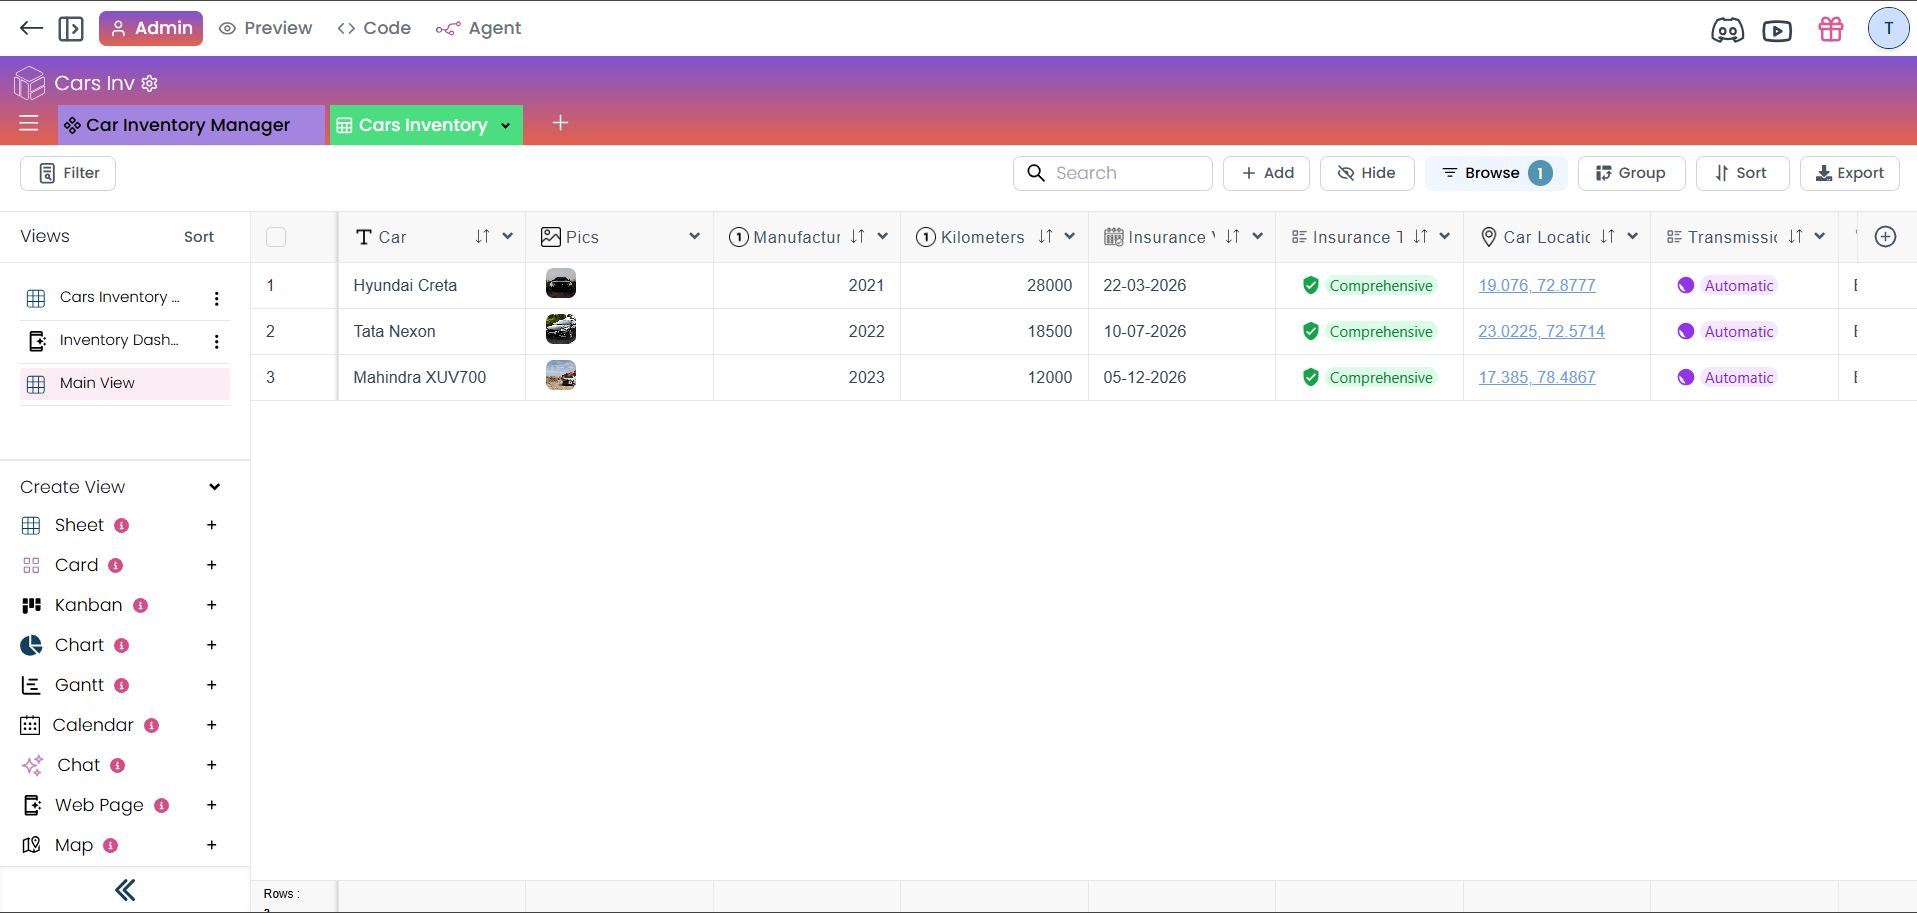
Once you apply the filter, it will display the filtered data based on your conditions.
Create Filter
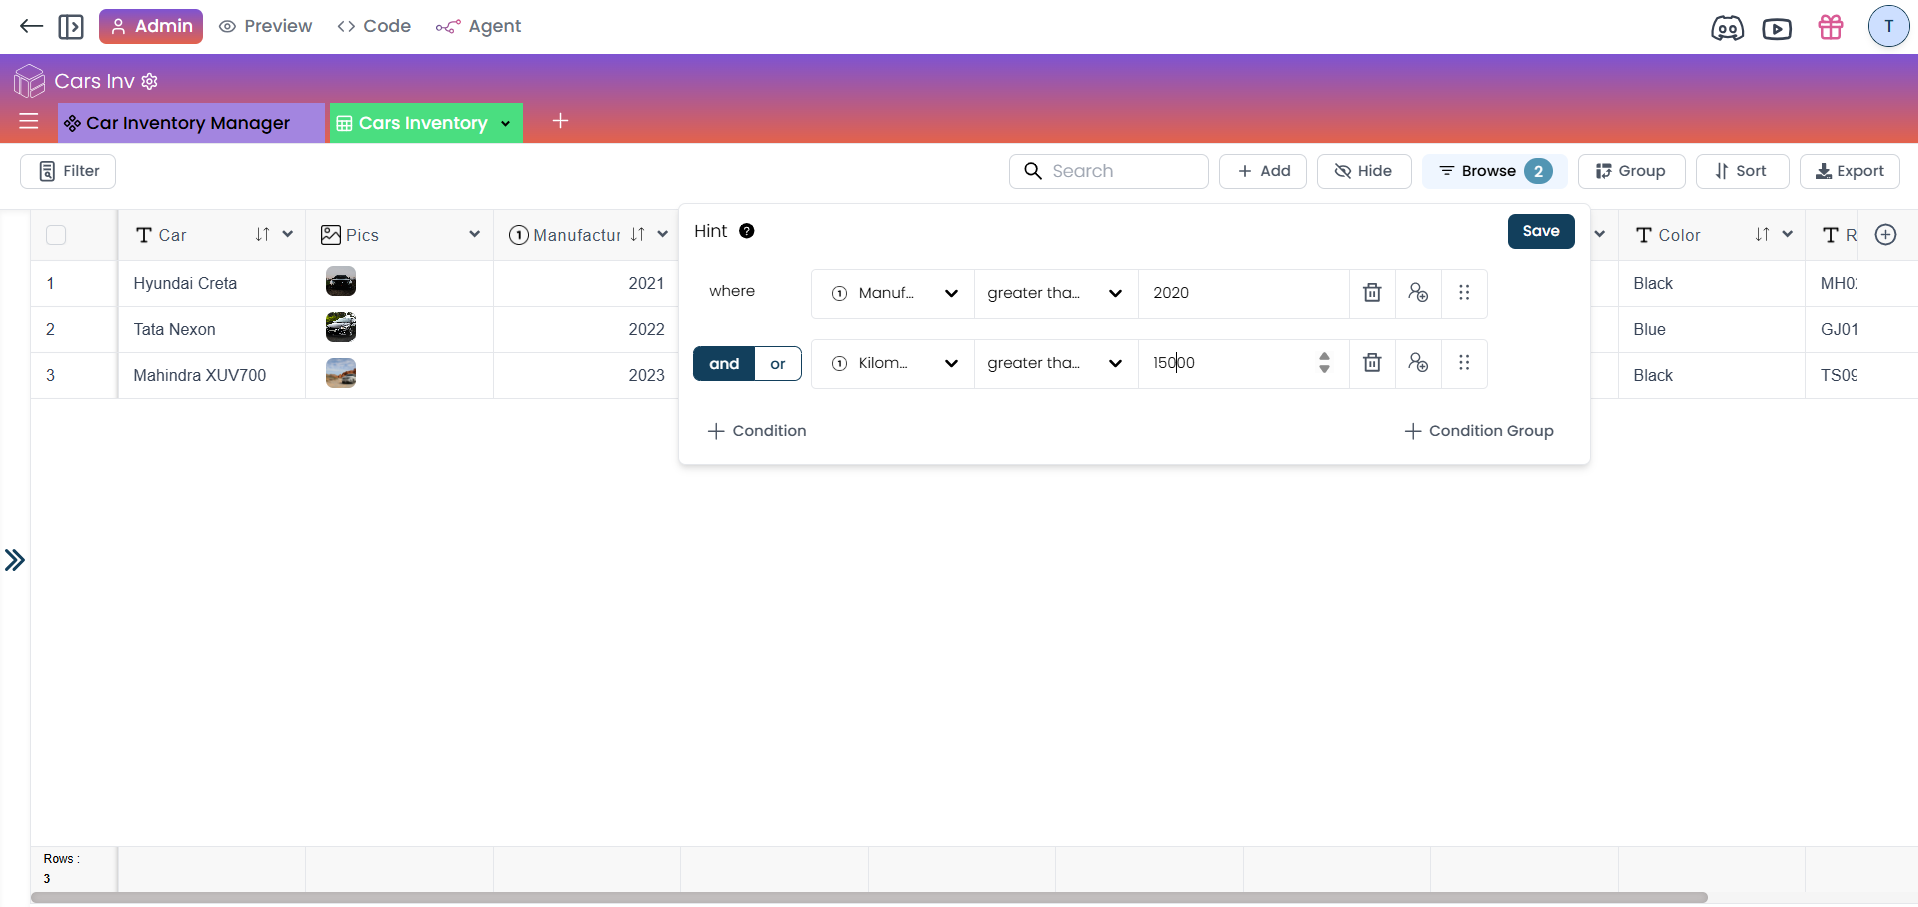
You can also create filters for conditions such as kilometers greater than 15,000.
Advanced Filtering
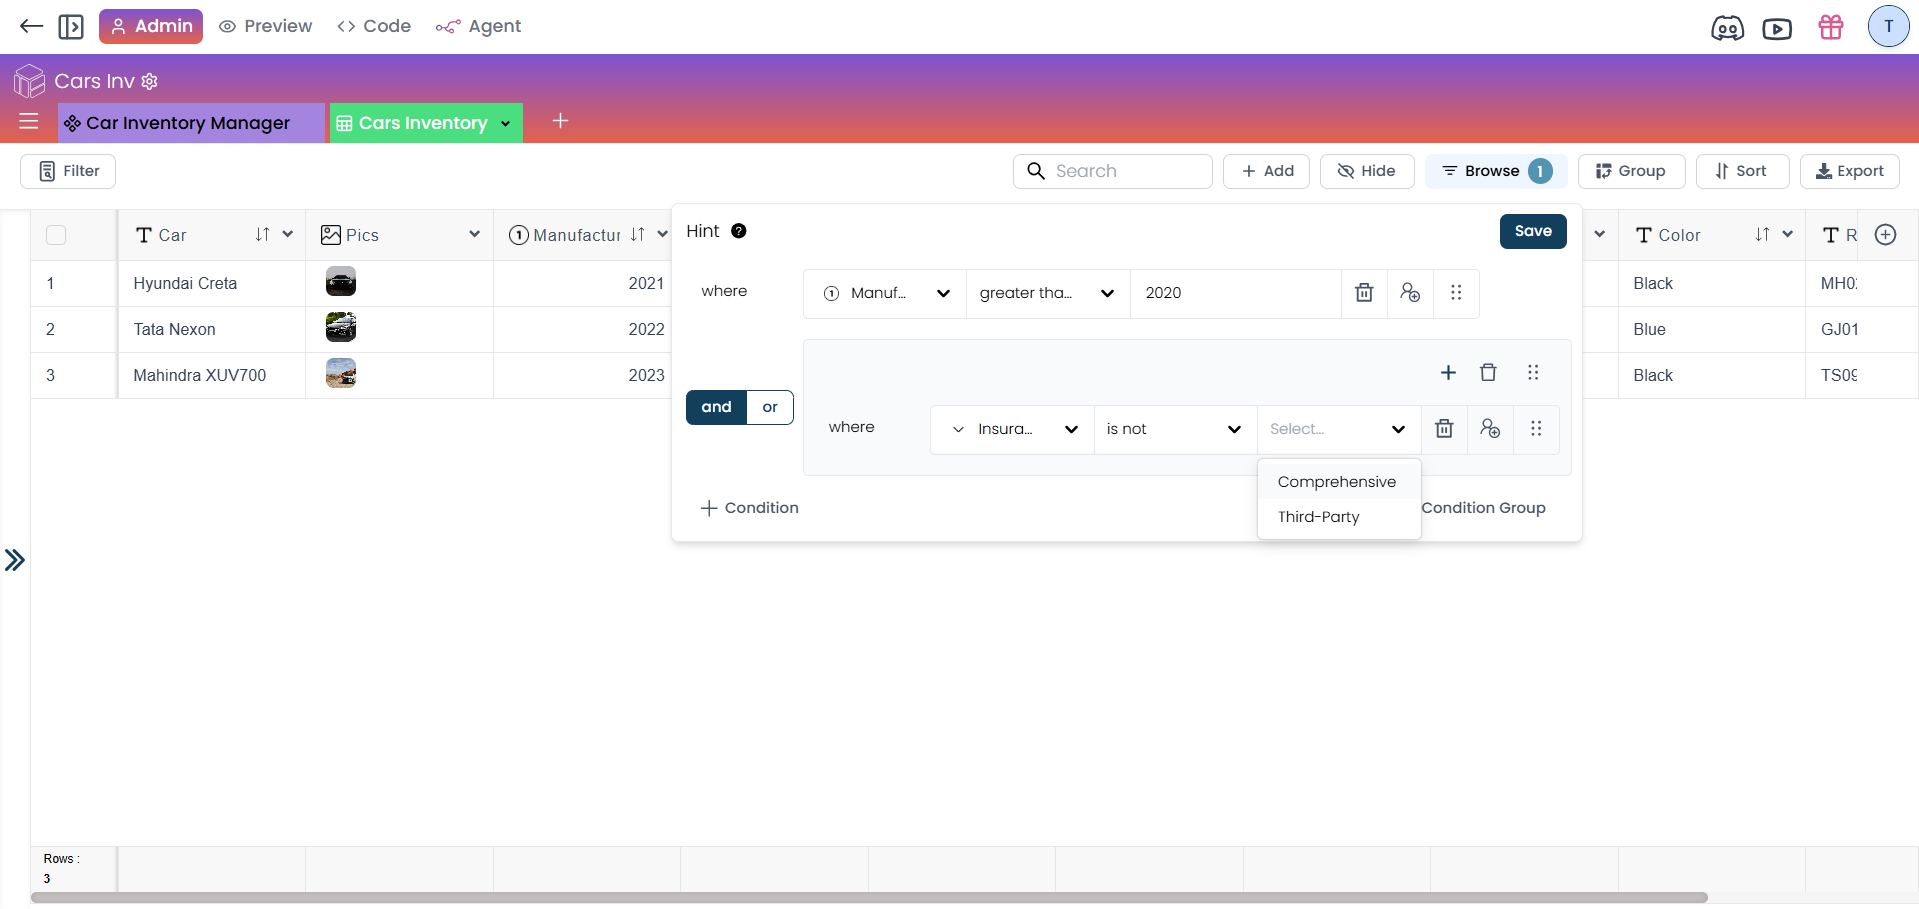
The advantage of this filter over a regular Excel filter is that you can add multiple conditions using AND or OR. You can achieve complex filtering with ease. Additionally, within a condition group, you can add further filters. For instance, you can specify that the Insurance Type is not Third Party.
Time-based Filters
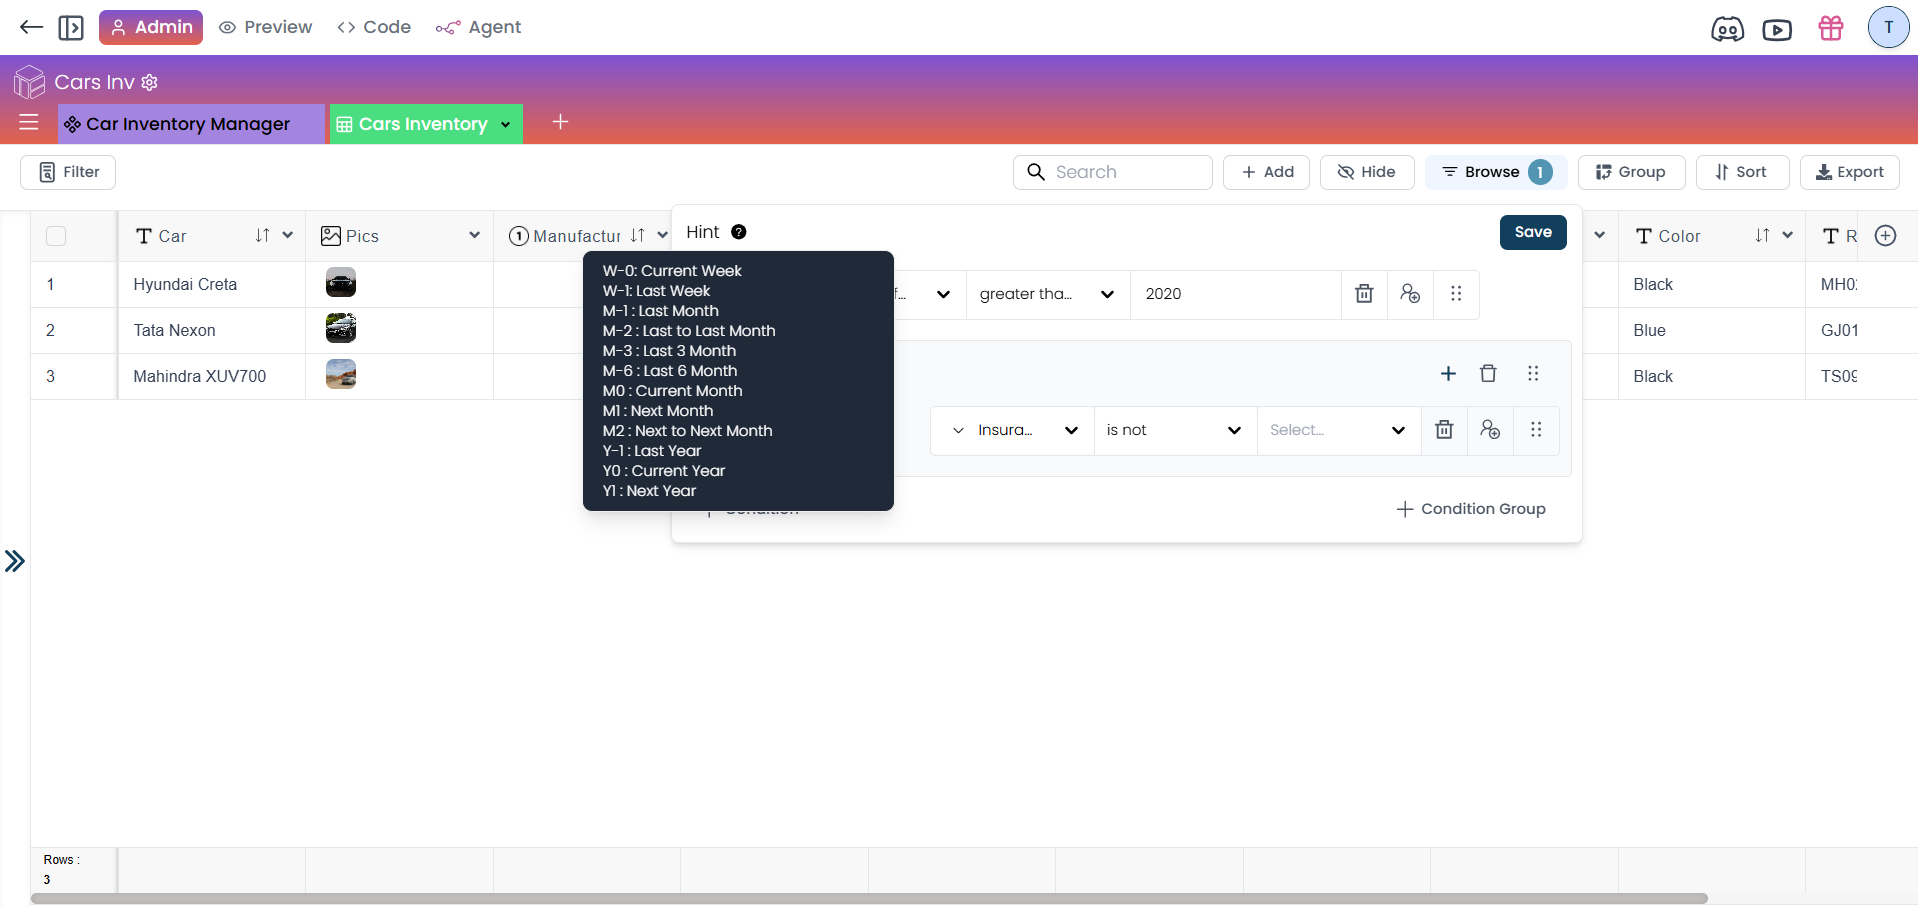
You can apply multiple filters for different time frames, such as the current week, last week, last month, next month, last year, and current year.
Apart from these advanced filters, a simple search option is also available to search data using regular filters. This provides greater flexibility when filtering your data. In subsequent tutorials, we will explore more features to expand your knowledge of TableSprint.